Article 2.1c of the Paris Agreement establishes that the world's financial flows must be made consistent with a pathway towards low greenhouse gas emissions. This is precisely what Nysnø has been set up to help achieve. We invest in early-stage climate technology because private capital alone does not flow quickly enough into the solutions the world needs. To document that we are actually making a difference, we measure and report the climate impact of all our investments.
At Nysnø, climate impact calculations are an integrated part of the investment process. This helps ensure clear anchoring of climate work within the organisation and establishes climate calculations as a natural part of investment decisions, on par with financial analysis and reporting. At the same time, we work continuously to improve our reporting and reduce both our own emissions and the portfolio’s overall climate footprint.
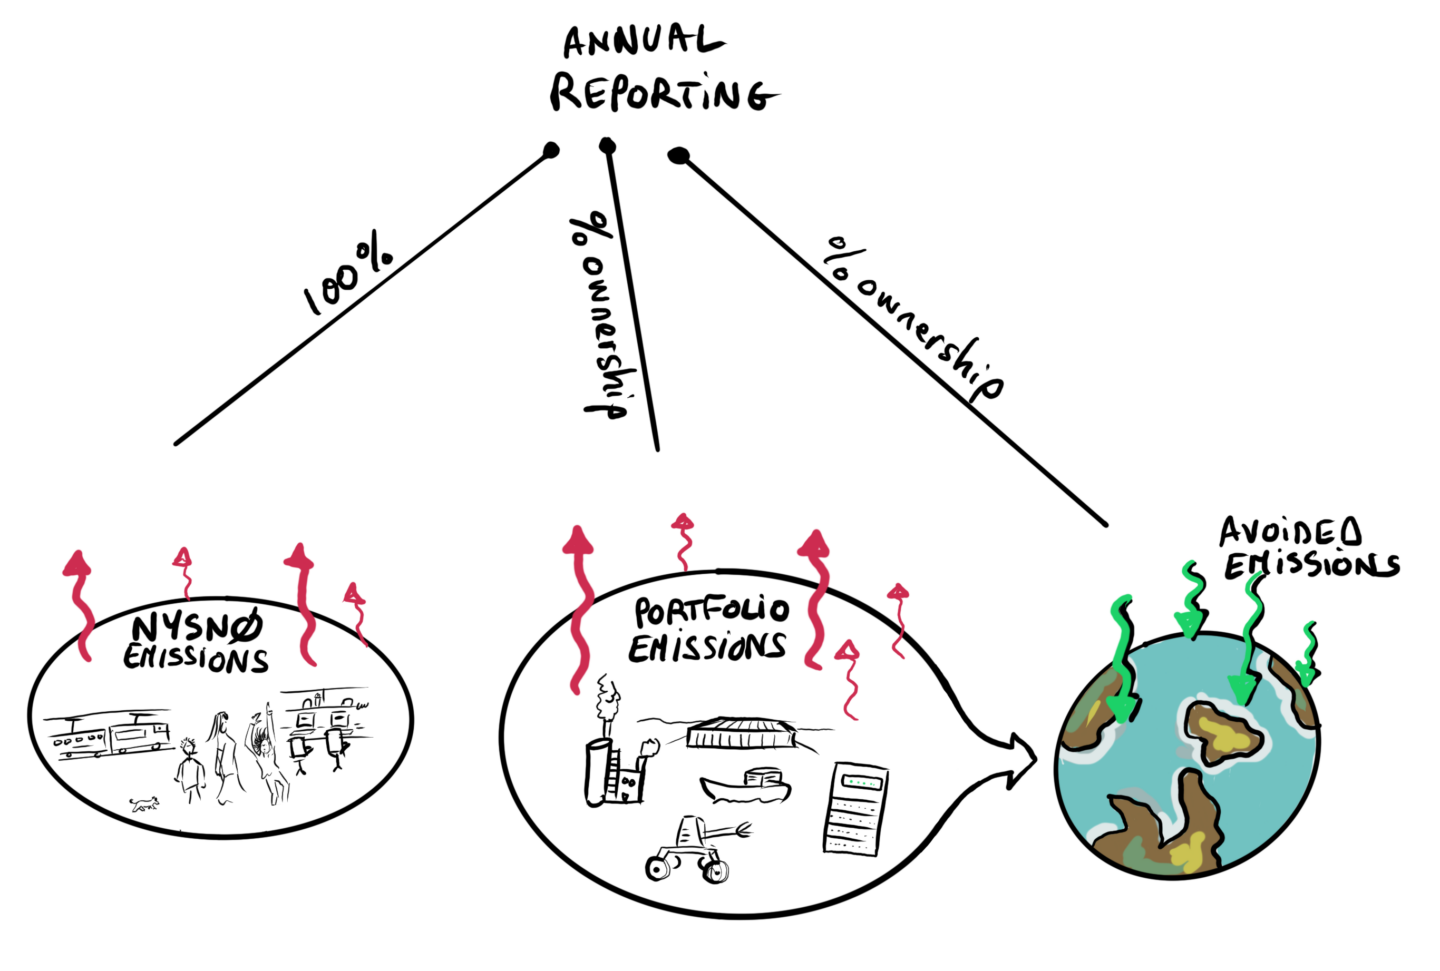
Figure: Nysnø aims to report its own emissions, the portfolio’s emissions, and aggregated avoided emissions.
Definitions
Scope 1
Direct emissions. Examples: Vehicles and machinery, factories
Scope 2
Indirect emissions from energy consumption
Scope 3
Indirect emissions from services and goods in the value chain. 15 categories. Examples: products, services, waste, travel, transport and distribution
Scope 4
Avoided emissions. The greenhouse gas emissions that are not released into the atmosphere as a result of a specific climate solution
Cost-based emissions
Links costs to industry codes and multiplies them by the corresponding emission factors
Activity-based emissions
Uses activity-based physical data multiplied by the corresponding emission factors
Avoided emissions from the portfolio
Nysnø’s most important contribution to emission reductions comes through investments in companies and funds that develop and scale climate solutions. We report annually on the climate impact of the portfolio, including calculations of avoided emissions (scope 4) and financed emissions. A more detailed description of the methodology, assumptions and results can be found in Nysnø’s annual report.
Nysnø continues its work on reporting financed emissions in collaboration with the climate reporting platform Morescope, which is now part of Position Green. Through this solution, portfolio companies gain access to the software to calculate and report their emissions, which contributes to a more accurate climate accounting and increased awareness around climate impact calculations.
How do we measure climate impact?
Nysnø invests in companies that help reduce greenhouse gas emissions globally. To quantify this effect in a credible and transparent way, we have helped develop a methodology for calculating avoided emissions. We are active participants in Project Frame, a global initiative to establish common standards for this type of climate reporting, and we update our methodology as the field continues to evolve.
Avoided emissions are greenhouse gas emissions that are not released into the atmosphere because a climate solution replaces a more emission-intensive solution. We calculate this as the difference between the emissions from the prevailing solution and the emissions from the climate solution we have invested in. We distinguish between three types of avoided emissions. Realised emissions are effects that have already occurred and can be documented with actual data. Planned emissions are future effects based on realistic scenarios for commercial scaling. Potential emissions represent the maximum theoretical potential if the solution is fully implemented in the market.
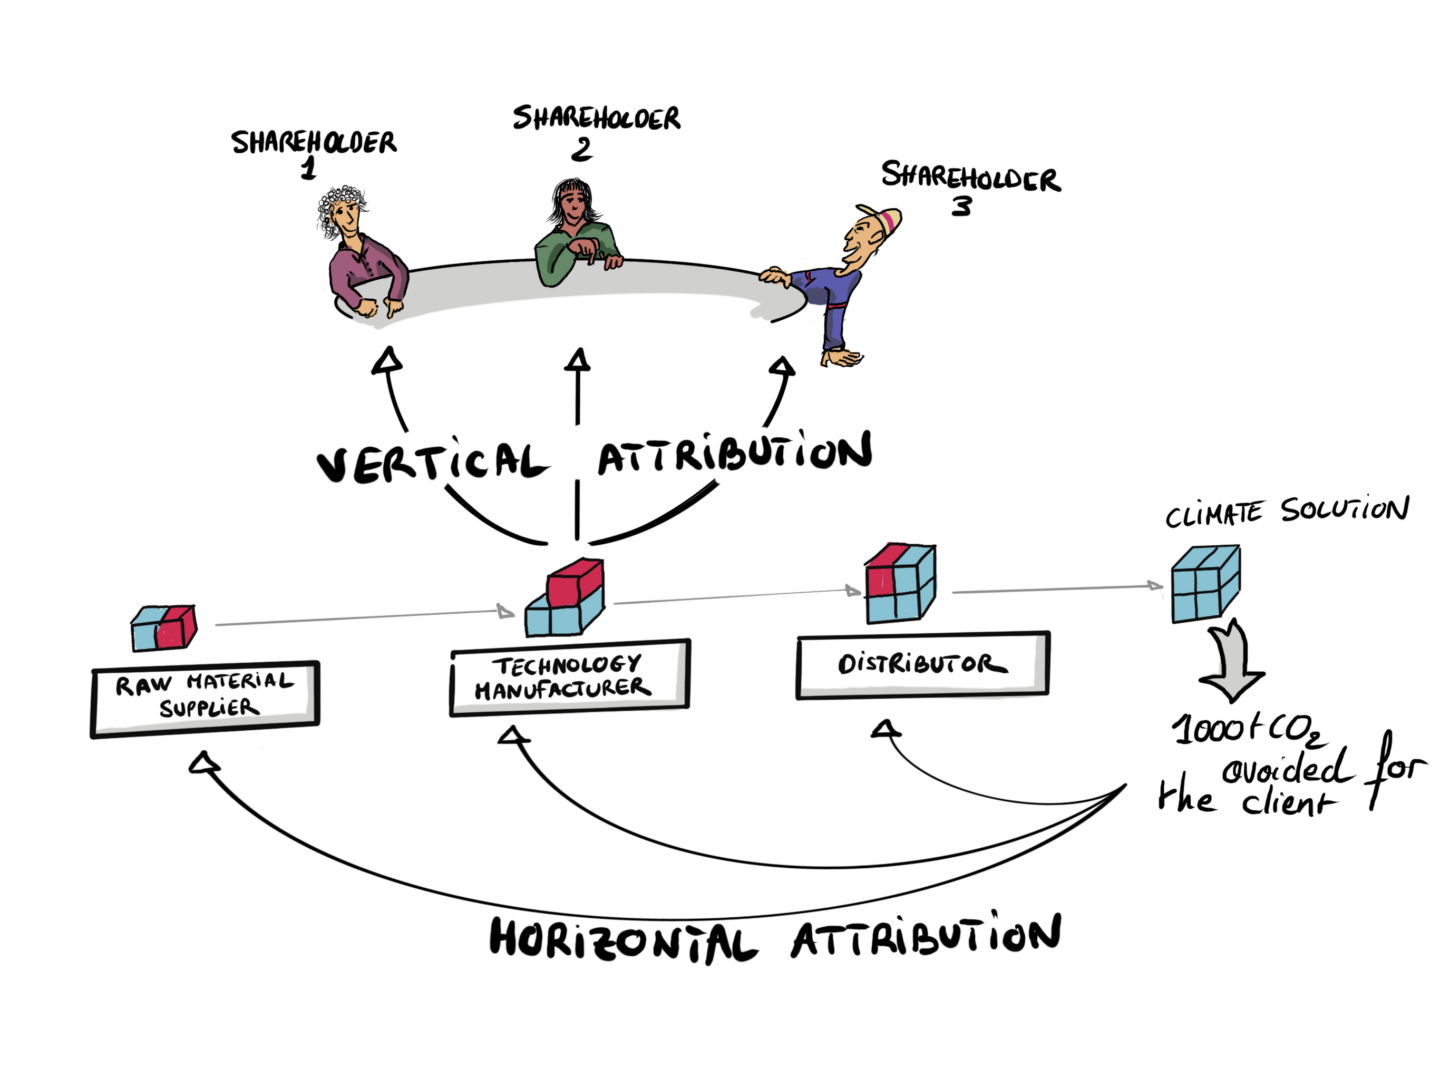
For each climate solution, we prepare an impact list describing the mechanisms behind the emission reduction. Each effect is categorised according to whether it is recurring or a one-off, and whether it is directly induced by the climate solution or merely enabled by it. We also establish a dynamic baseline that accounts for the fact that the world is moving towards lower emissions over time regardless. We report avoided emissions adjusted for our ownership share in each company.
Illustration of horizontal and vertical attribution for a given climate solution.